Since I really enjoy using the ichimoku cloud which is also known as the ichimoku Kinko, I thought I might share my more advanced tradingview settings for the ichimoku cloud.
Get a free tradingview account here
The basic settings which can be found here (Ichimoku Cloud Settings for Tradingview) are definitely enough to get you started.
However, I soon found out that there were too many limitations and not enough customization options with the basic ichimoku cloud indicator.
So without further ado, let’s begin with the crypto ichimoku cloud settings using pine script:
Tradingview Ichimoku Settings with Pinescript
Log in to tradingview with your account
Click on the Pine Editor tab at the bottom of the screen
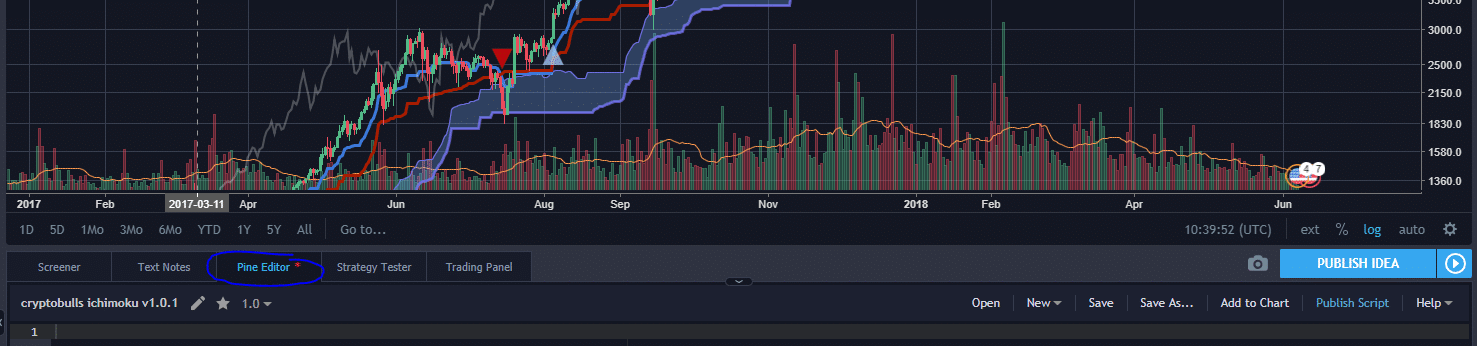
Copy and paste the following code into your Pine script editor
// ICHIMOKU CLOUD V1.0
//
study(title="CM_Enhanced_Ichimoku Cloud-V5.2", shorttitle="CM_Enhanced_Ichimoku-V5.2", overlay=true)
turningPeriods = input(20, minval=1, title="Tenkan-Sen")
standardPeriods = input(60, minval=1, title="Kijun-Sen")
specialAPeriods = input(120, minval=1, title="Kijun-Sen (auxiliary)")
leadingSpan2Periods = input(120, minval=1, title="Senkou Span B")
displacement = input(30, minval=1, title="-ChikouSpan/+SenkouSpan A")
sts = input(true, title="Show Tenkan-Sen")
sks = input(true, title="Show Kijun-Sen")
sksA = input(true, title="Show Kijun-Sen (auxiliary)")
sll = input(true, title="Show Chikou Span (lagging span)?")
sc = input(true, title="Show cloud")
cr1 = input(true, title="Show crossings Tenkan/Kijun")
//Definitions for Tenkan-Sen (20 Period), Kijun-Sen (60 Period), Chikou Span (Lagging Line)
donchian(len) => avg(lowest(len), highest(len))
turning = donchian(turningPeriods)
standard = donchian(standardPeriods)
specialA = donchian(specialAPeriods)
leadingSpan1 = avg(turning, standard)
leadingSpan2 = donchian(leadingSpan2Periods)
//Crosses up/down Tenkan-Sen (20 Period) and Kijun-Sen (60 Period)
crossUpTenkanKinjun = turning[1] < standard[1] and turning >= standard ? 1 : 0
crossDnTenkanKinjun = turning[1] > standard[1] and turning <= standard ? 1 : 0
leadingSpan1Above = leadingSpan1 >= leadingSpan2 ? 1 : na
leadingSpan2Below = leadingSpan1 <= leadingSpan2 ? 1 : na
span1plotU = leadingSpan1Above ? leadingSpan1 : na
span2plotU = leadingSpan1Above ? leadingSpan2 : na
span1plotD = leadingSpan2Below ? leadingSpan1 : na
span2plotD = leadingSpan2Below ? leadingSpan2 : na
col = leadingSpan1 >= leadingSpan2 ? #7D71FC : #E68F8F // bullish, bearish
//Cloud Lines Plot Statements - ***Regular Lines to Fill in Break in Gap
plot(sc and leadingSpan1 ? leadingSpan1 : na, title = 'Senkou Span A cloud', style=line, linewidth=1, offset = displacement, color=col)
plot(sc and leadingSpan2 ? leadingSpan2 : na, title = 'Senkou Span B cloud', style=line, linewidth=3, offset = displacement, color=col)
//Cloud Lines Plot Statements - ***linebr to create rules for change in Shading
p1 = plot(sc and span1plotU ? span1plotU  : na, title = 'Senkou Span A above Span B Cloud', style=linebr, linewidth=1, offset = displacement, color=col)
p2 = plot(sc and span2plotU ? span2plotU  : na, title = 'Senkou Span B below Span A Cloud', style=linebr, linewidth=1, offset = displacement, color=col)
p3 = plot(sc and span1plotD ? span1plotD  : na, title = 'Senkou Span A below Span B Cloud', style=linebr, linewidth=1, offset = displacement, color=col)
p4 = plot(sc and span2plotD ? span2plotD  : na, title = 'Senkou Span B above Span A Cloud', style=linebr, linewidth=1, offset = displacement, color=col)
//Fills that color cloud based on Trend.
fill(p1, p2, color=#361CCA  ,title='Kumo (Cloud)')    // bullish cloud
fill(p3, p4, color=#CA1C59, title='Kumo (Cloud)')    // bearish cloud
//plots for 3 lines other than cloud.
plot(sts and turning ? turning : na, title = 'Tenkan-Sen', linewidth=2, color=orange, transp=0)
plot(sks and standard ? standard : na, title = 'Kijun-Sen', linewidth=3, color=blue, transp=0)
plot(sksA and specialA ? specialA : na, title = 'Kijun-Sen auxiliary I', linewidth=2, color=black, transp=0)
plot(sll and close ? close : na, title='Chikou Span (Lagging Span)', linewidth=2, offset = -displacement, color=#A900FF)
//Arrow Plots At Tenkan-Sen (20 Period) and Kinjun-Sen (60 Period)
plotchar(cr1 and crossUpTenkanKinjun ? leadingSpan1 : na, title="CrossUp Tenkan Kijun Entry Arrow",char='▲', color=black, transp=0, location=location.absolute, size=size.small)
plotchar(cr1 and crossDnTenkanKinjun ? leadingSpan1 : na, title="CrossUp Tenkan Kijun Entry Arrow",char='▼', color=black, transp=0, location=location.absolute, size=size.small)
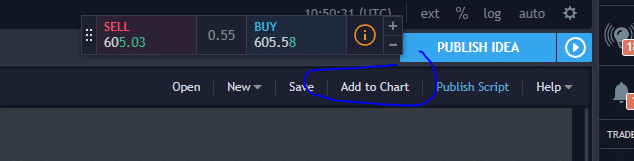
As soon as you copied the code, you can save it and then click on Add to Chart.
Your chart should look like this
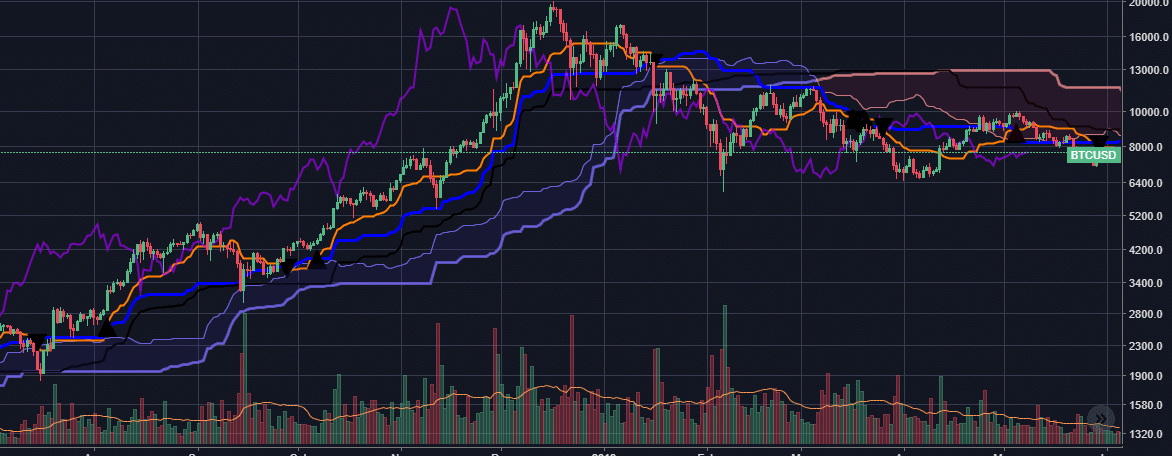
From here, you can customise the clouds colors as you wish.
This is how I like to customise the ichimoku cloud
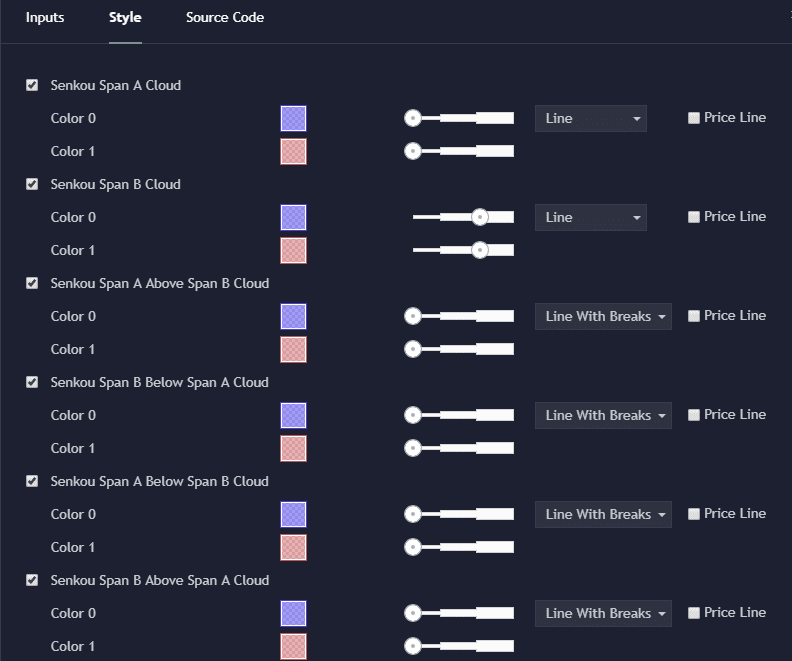
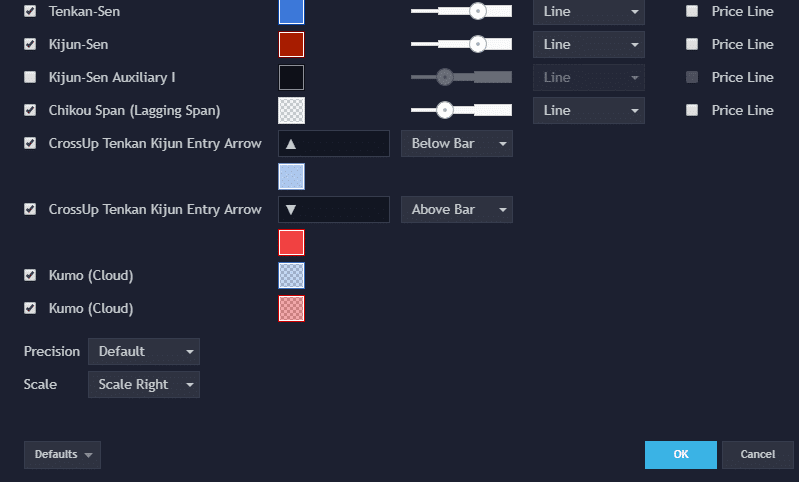
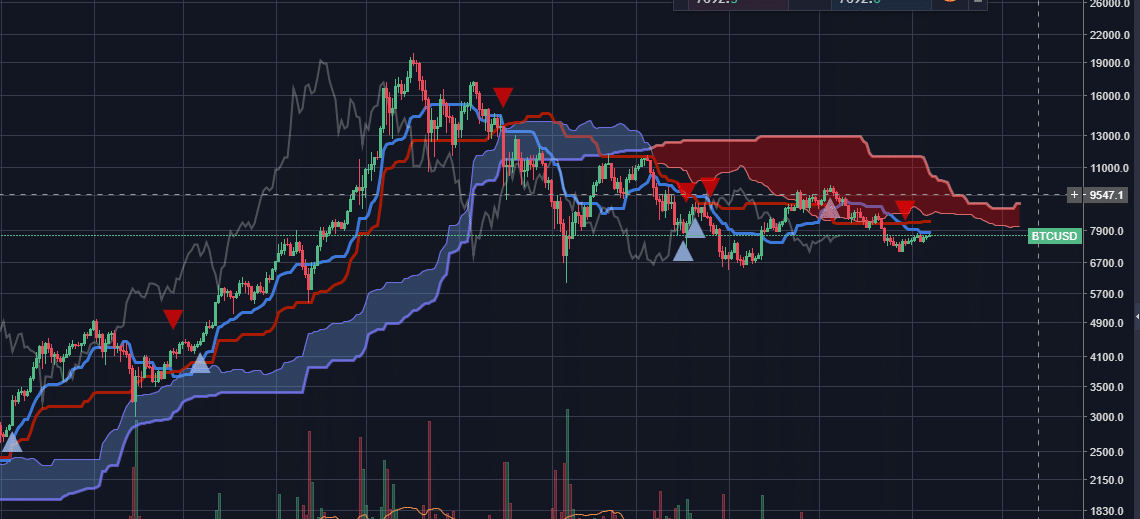
Below is a reference image of what the different names mean and how the cloud will look like after customising it based on my preferences.
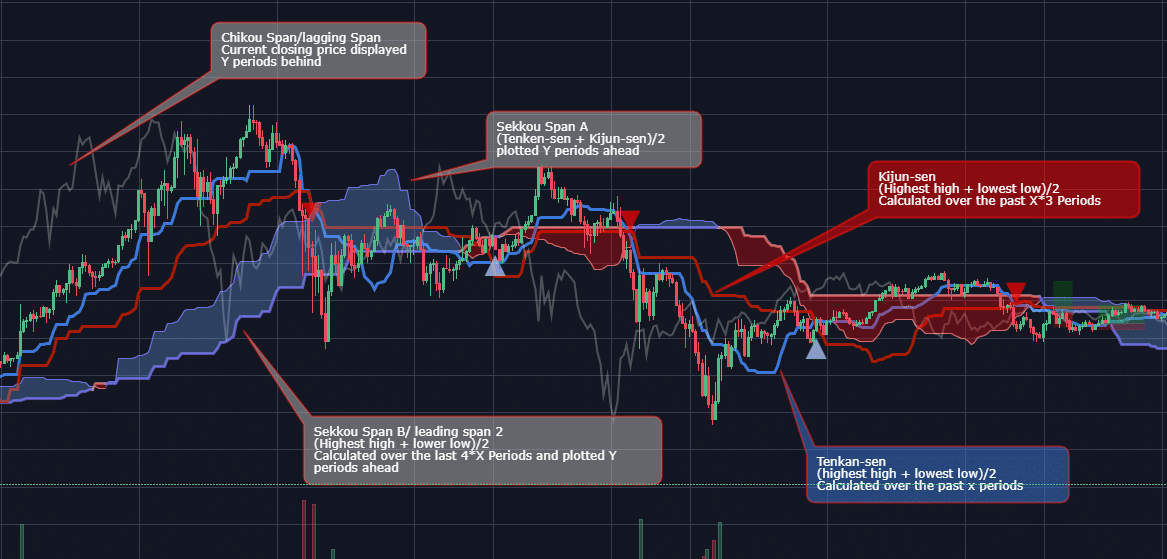
One setting that is pretty useful are the triangles that appear when there is a tiki cross.
A blue triangle means a bullish TK cross
A red triangle means a bearish TK cross
However, I won’t go into too much detail on what they mean in this post. For that you can check out my Beginners ichimoku guide for Crypto.
Hope you enjoyed this post.