Trading is definitely not easy. However, getting started and learning the basics in order to make smart and profitable trades gets easier the more you learn about the markets. The following indicator created b Chrismoody is based on percentile outliers and bolling bands standard deviation.
You can read the following post to learn more about Bollinger Bands: How to Trade using Bollinger Bands
However, this knowledge is not necessary for using this indicator.
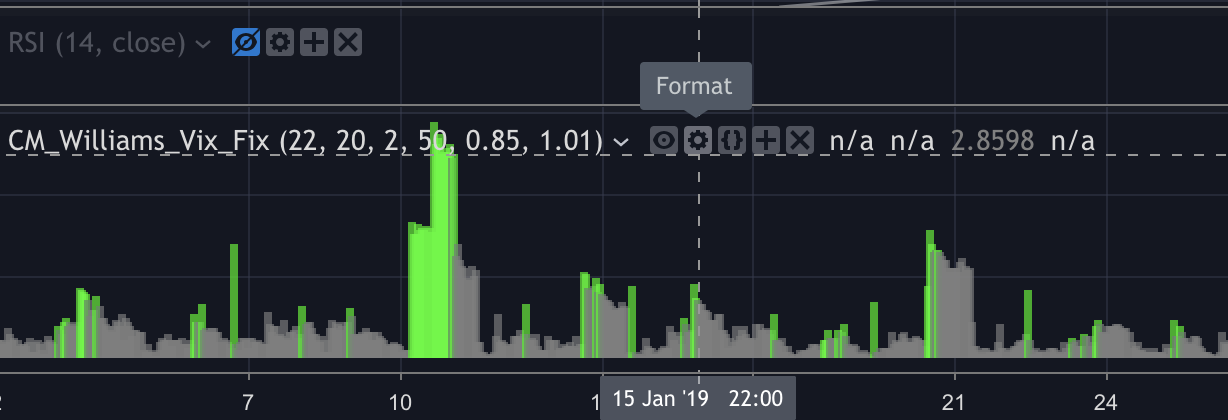
Below is an example of the indicator using the BTC/USD on a daily time frame. In my opinion, this indicator works best for long term trades and for accumulation strategies. By pointing out price outliers, it can help you dollar cost average. An important thing to note is that this indicator can not predict future price movements. It can not predict if the price will go down further after a dip. The first green bar might not be the end of the correction.
BTC/USD Daily timeframe (The trendlines are not part of the indicator)

The height of the bars in the chart represent the amount of deviation from the price. After such a high deviation the price is most likely going to go back to the mean. This strategy can help investors with little or no knowledge by the dips and possibly prevent fomo.
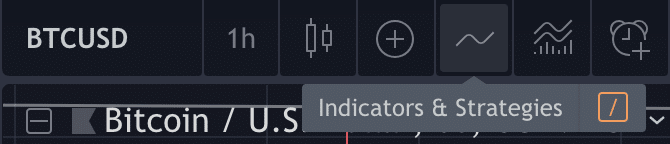
Activating the Market Bottoms Finder Indicator
Activating this indicator on tradingview is relatively easy. Go to tradingview and create a free account.
- Click on indicators
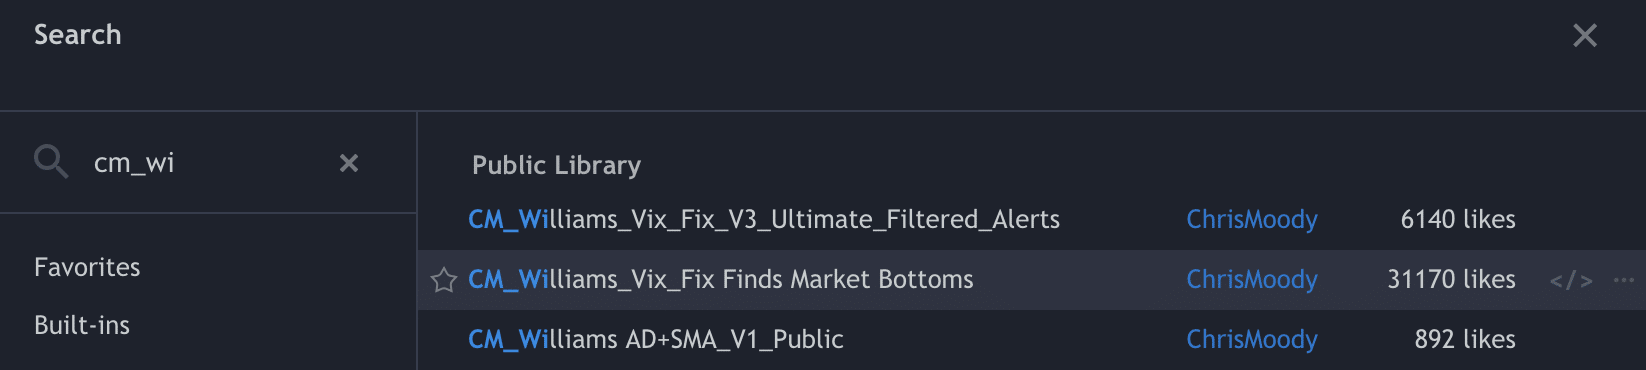
- search for “cm_williams“. In the search results you will find the indicator: “cm_williams_vix_fix Finds Market Bottoms“
As soon as you have done that, you can click on the little cog wheel next to the indicator name to customise different settings.
You can change the color settings under the style tab.
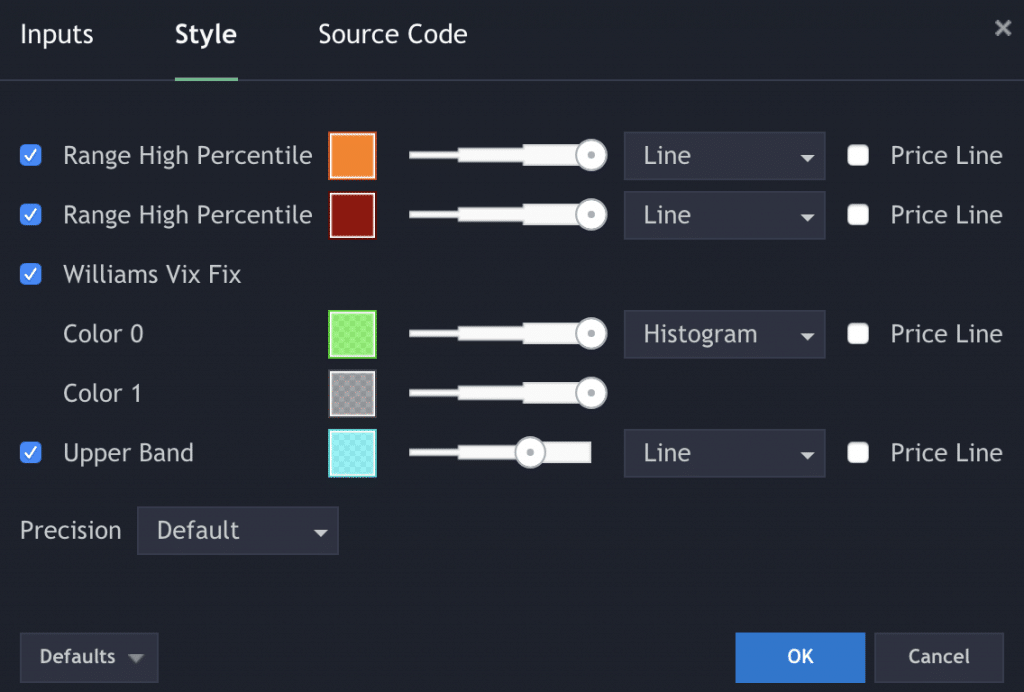
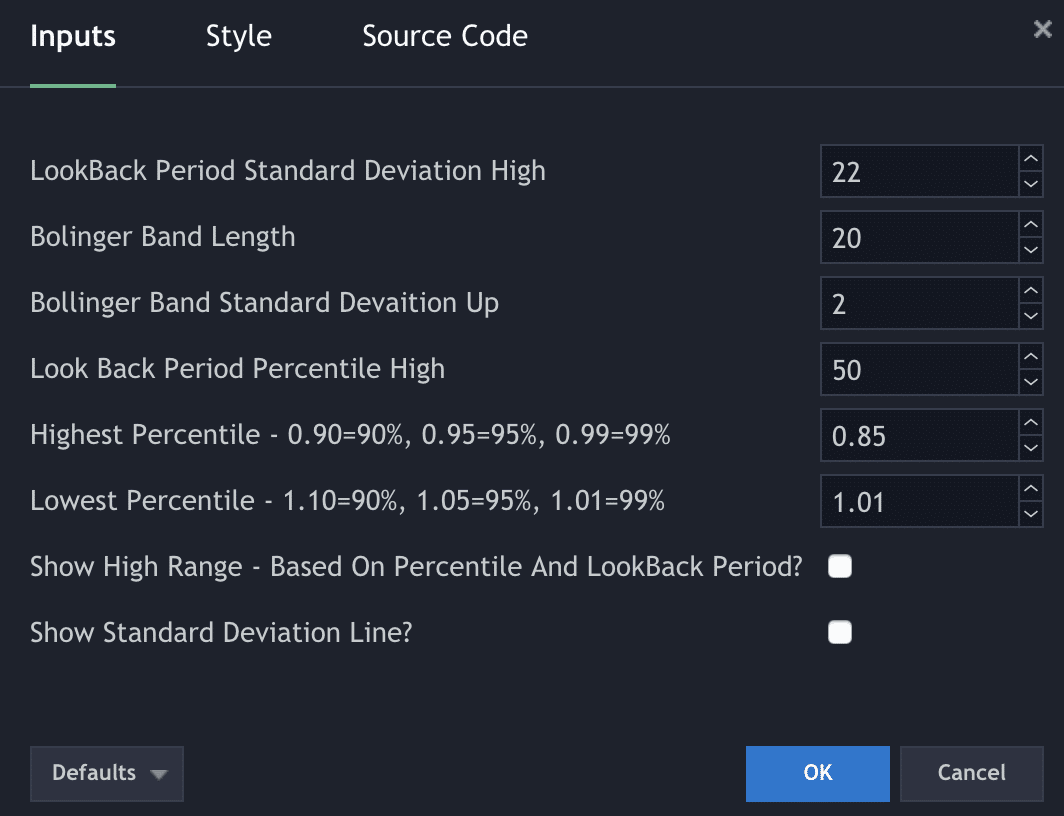
Under the input tabs you can change the parameters to make the indicator more or less sensible. If you are not sure about the settings I recommend keeping the ones that are defined.
Below is the pinescript code of the indicator. You can review it and offer suggestions if you feel like there is room for improvement.
- study("CM_Williams_Vix_Fix", overlay=false)
- pd = input(22, title="LookBack Period Standard Deviation High")
- bbl = input(20, title="Bolinger Band Length")
- mult = input(2.0 , minval=1, maxval=5, title="Bollinger Band Standard Deviation Up")
- lb = input(50 , title="Look Back Period Percentile High")
- ph = input(.85, title="Highest Percentile - 0.90=90%, 0.95=95%, 0.99=99%")
- pl = input(1.01, title="Lowest Percentile - 1.10=90%, 1.05=95%, 1.01=99%")
- hp = input(false, title="Show High Range - Based on Percentile and LookBack Period?")
- sd = input(false, title="Show Standard Deviation Line?")
- wvf = ((highest(close, pd)-low)/(highest(close, pd)))*100
- sDev = mult * stdev(wvf, bbl)
- midLine = sma(wvf, bbl)
- lowerBand = midLine - sDev
- upperBand = midLine + sDev
- rangeHigh = (highest(wvf, lb)) * ph
- rangeLow = (lowest(wvf, lb)) * pl
- col = wvf >= upperBand or wvf >= rangeHigh ? lime : gray
- plot(hp and rangeHigh ? rangeHigh : na, title="Range High Percentile", style=line, linewidth=4, color=orange)
- plot(hp and rangeLow ? rangeLow : na, title="Range High Percentile", style=line, linewidth=4, color=orange)
- plot(wvf, title="Williams Vix Fix", style=histogram, linewidth = 4, color=col)
- plot(sd and upperBand ? upperBand : na, title="Upper Band", style=line, linewidth = 3, color=aqua)