Table of Contents
Using EMA as a Trading Strategy
Traders all over the world enter the market with a sole purpose of turning a profit.
Analysts and traders used-and continue to use-this tool for one grand reason:
Moving averages are ‘Turing” complete . They are easily adapted to any chart irrespective of the item being traded.
If you want to start using moving averages in your cryptocurrency chart, then you must know what they are.
Understanding Moving Averages
A moving average is a line derived from a mathematical formula that averages a given set of price points drawn from a specific period of time.
A 20 day moving average for example will average the closing prices of the last 20 trading days of a token in focus.
The good thing is that it doesn’t have to be the closing price only. Moving average can be fine tuned to base their averages on close, open, high, low or even median prices. This flexibility is what makes this tool attractive to many professional traders.
Significance of Moving Averages and EMA
A moving average that is weighted equally across all periods is called a Simple Moving Average (SMA) and it is the foundation of all variation of moving averages of which an Exponential Moving Average, simply known as an EMA is an example.
EMA Formula:
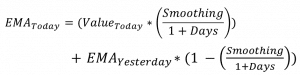
The EMA has a fast response time because of the multiplier effect used when calculating it. It differs from the SMA because emphasis is laid more on recent prices and weighted accordingly. The multiplier fuses price action and helps smooth volatility which in turn makes the EMA line more responsive to price changes.
When used as a strategy, up-to 3 EMAs can be used effectively in a single chart. Of course, traders can choose from several popular EMAs like the 5, 10, 20, 50, 100 and 200 but choices are heavily dependent of the trader’s style and preferred time frame.
When 3 EMAs are used as a strategy, the longer time frame like the 200 EMA is used for trend definition.
If prices are rallying for example, two shorter time frame EMAs can be introduced to fine tune entries. Most traders use 20 and 50 EMA crossovers to generate trading signals.
Don’t fret it’s pretty simple to use.
Buy Entries
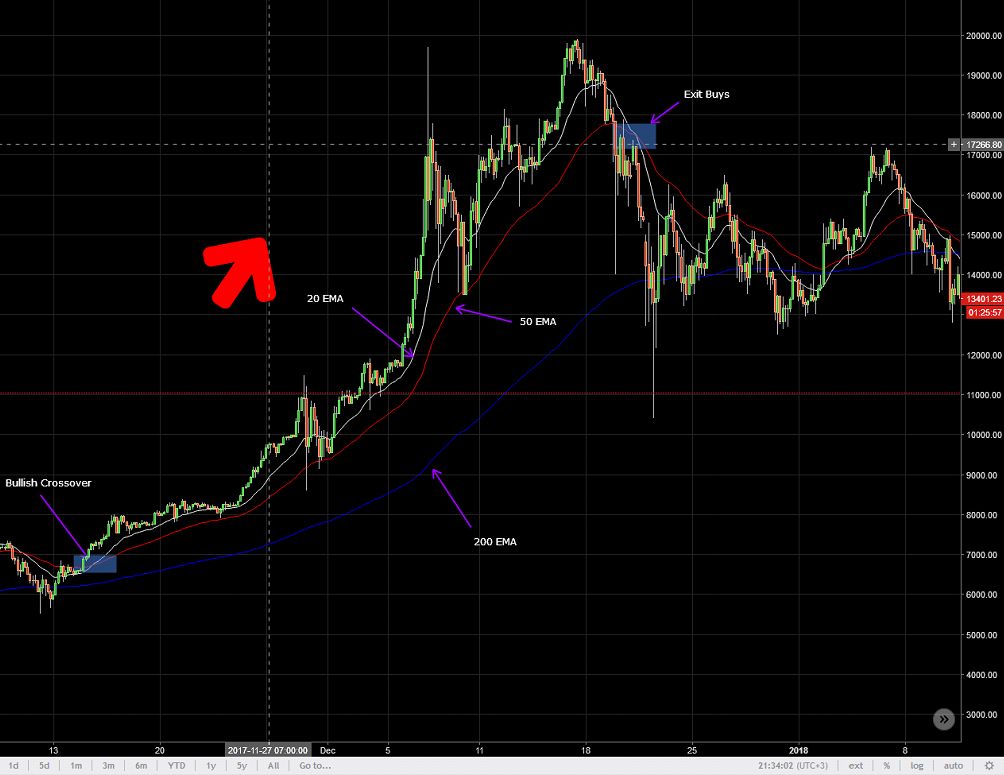
Figure 1: Buy signals
When prices are rallying, the 200 EMA will act as the main support line. Buy entries are initiated only if the 20 EMA crossover and trend above the 50 EMA. When momentum slows down, it’s time to exit the trade if the 20 EMA crossover and trend below the 50 EMA.
Sell Entries
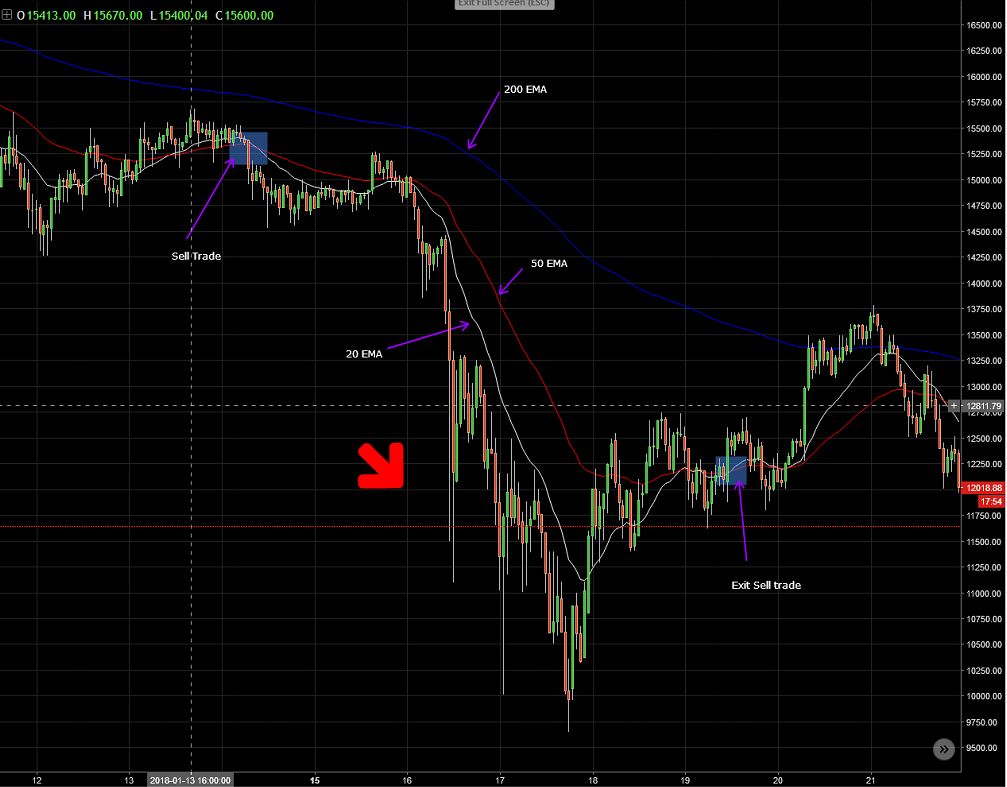
Figure 2: Sell Signals
Conversely, in a down trend, the 200 EMA acts as resistance line and sells are initiated when the 20 EMA cross and trend below the 50 EMA. Trades would be exited if the 20 EMA crossover the 50 EMA and trends above it.
Weakness of EMA Trading Strategy
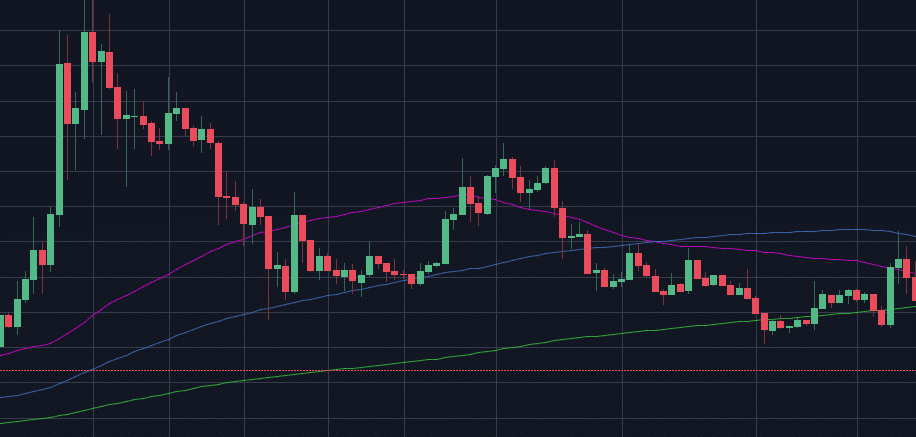
Remember, there is no strategy that is foolproof and using EMA to signal entries has its own drawbacks. EMAs perform extremely well in trending markets but are terrible in ranging markets. In such markets, many fake signals are generated and as to counter such, the best practice is to wait until a clear trend has been defined. You can easily notice a trending market because prices will oscillate above (below) the 20 EMA in a bullish (bearish) market.