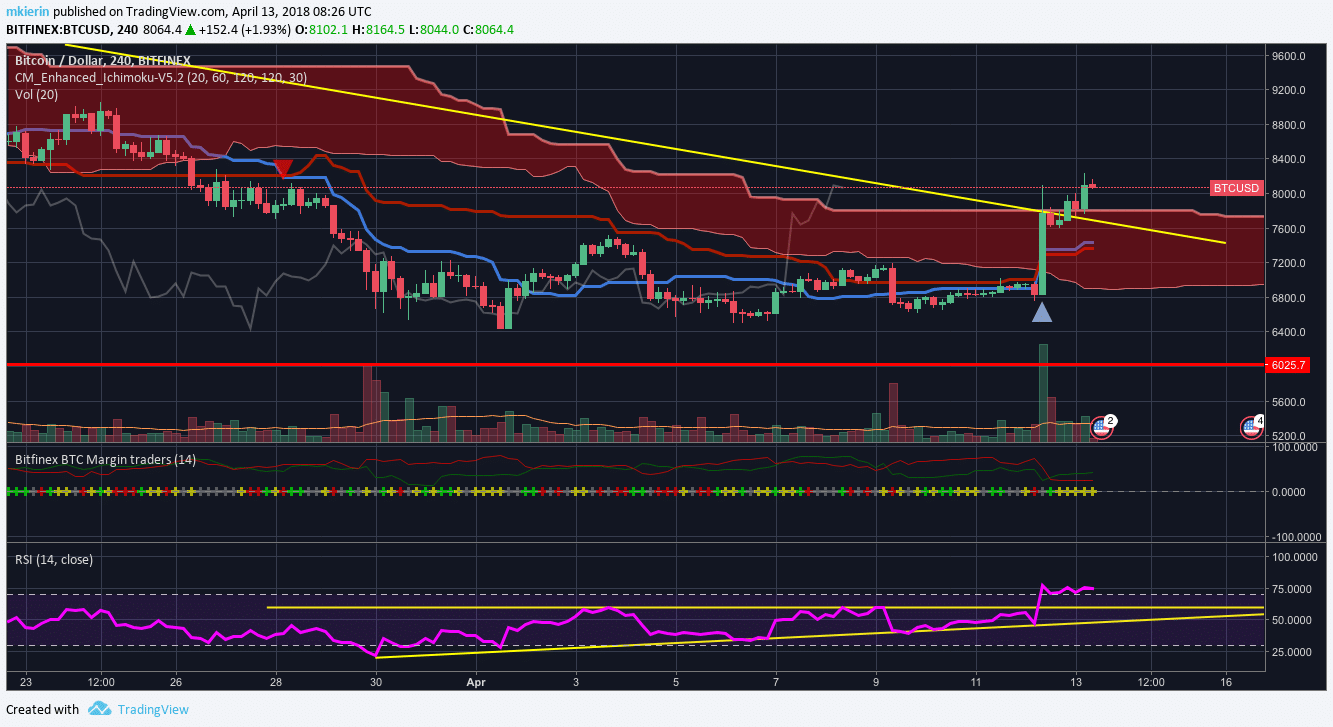
This is a very useful Pinescript I use on Tradingview to visualize if there are more Short or long positions on a specific candle.
The amount of shorts and longs are represented by crosses and two moving averages.
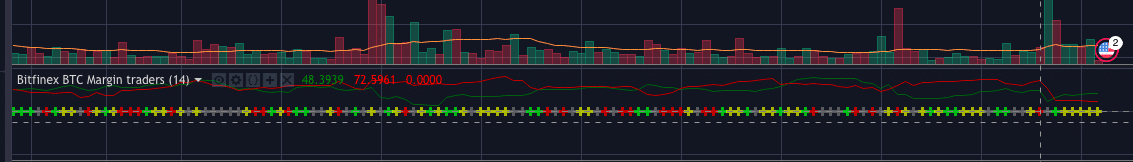
- Grey Cross = Traders are undecisive. There is an equilibrium of shorts and longs
- Red Cross = Traders are bearish. There are more shorts than longs
- Green Cross = Traders are bullish. There are more longs than shorts
I feel like this is especially useful on longer timeframes to judge market sentiment. However, I would definitely not use this as an indicator to go long or short.
I like that it gives me additional information on the sentiment of traders.
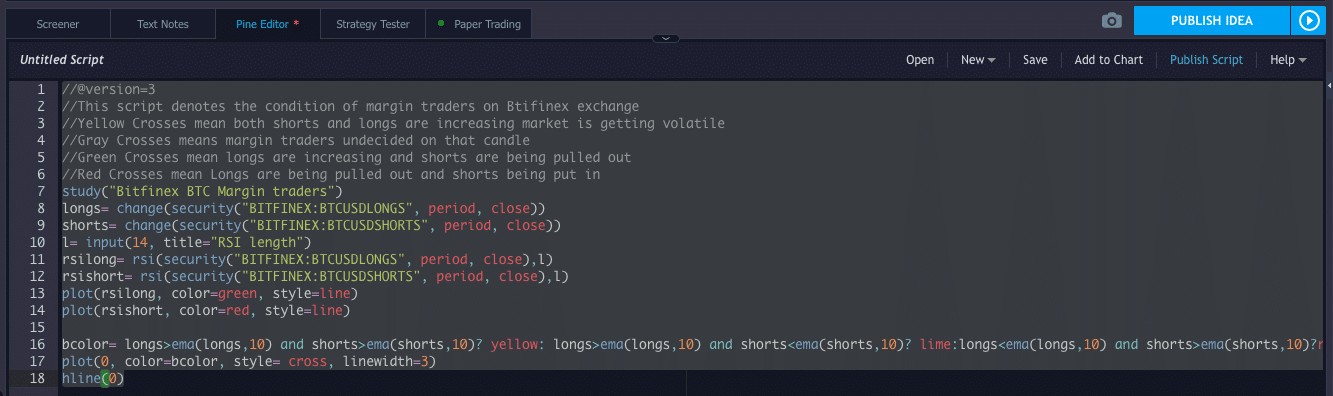
You can copy the script down below and add it to your Tradingview chart.
BTC/USD Margin Shorts and Long on Bitfinex Pinescript
This is the script for BTC/USD margin longs and shorts
//@version=3
//This script denotes the condition of margin traders on Btifinex exchange
//Yellow Crosses mean both shorts and longs are increasing market is getting volatile
//Gray Crosses means margin traders undecided on that candle
//Green Crosses mean longs are increasing and shorts are being pulled out
//Red Crosses mean Longs are being pulled out and shorts being put in
study("Bitfinex BTC Margin traders")
longs= change(security("BITFINEX:BTCUSDLONGS", period, close))
shorts= change(security("BITFINEX:BTCUSDSHORTS", period, close))
l= input(14, title="RSI length")
rsilong= rsi(security("BITFINEX:BTCUSDLONGS", period, close),l)
rsishort= rsi(security("BITFINEX:BTCUSDSHORTS", period, close),l)
plot(rsilong, color=green, style=line)
plot(rsishort, color=red, style=line)
bcolor= longs>ema(longs,10) and shorts>ema(shorts,10)? yellow: longs>ema(longs,10) and shorts<ema(shorts,10)? lime:longs<ema(longs,10) and shorts>ema(shorts,10)?red:gray
plot(0, color=bcolor, style= cross, linewidth=3)
hline(0)
ETH/USD Margin Shorts and Longs on Bitfinex Pinescript
Here is the script for traders that prefer to have an overview of ether longs and shorts.
//@version=3
//This script denotes the condition of margin traders on Btifinex exchange
//Yellow Crosses mean both shorts and longs are increasing market is getting volatile
//Gray Crosses means margin traders undecided on that candle
//Green Crosses mean longs are increasing and shorts are being pulled out
//Red Crosses mean Longs are being pulled out and shorts being put in
study("Bitfinex ETH Margin traders")
longs= change(security("BITFINEX:ETHUSDLONGS", period, close))
shorts= change(security("BITFINEX:ETHUSDSHORTS", period, close))
l= input(14, title="RSI length")
rsilong= rsi(security("BITFINEX:ETHUSDLONGS", period, close),l)
rsishort= rsi(security("BITFINEX:ETHUSDSHORTS", period, close),l)
plot(rsilong, color=green, style=line)
plot(rsishort, color=red, style=line)
bcolor= longs>ema(longs,10) and shorts>ema(shorts,10)? yellow: longs>ema(longs,10) and shorts<ema(shorts,10)? lime:longs<ema(longs,10) and shorts>ema(shorts,10)?red:gray
plot(0, color=bcolor, style= cross, linewidth=3)
hline(0)
How to use the Script
Go to your Tradingview Account. (You can register for a free account)
When you are on the chart click on Pine Editor which is on the bottom of your window.
Paste the script into the Pine Editor
Click on Add to Chart
Save the Chart Layout
I hope you find this small script useful.
Have a great day