Table of Contents
Let’s get Started
First of all, if you haven’t already, go over to the post on setting up the ichimoku cloud for tradingview.
The image below might look complicated. But don’t get disheartened. The ichimoku cloud isn’t as complicated as it looks.
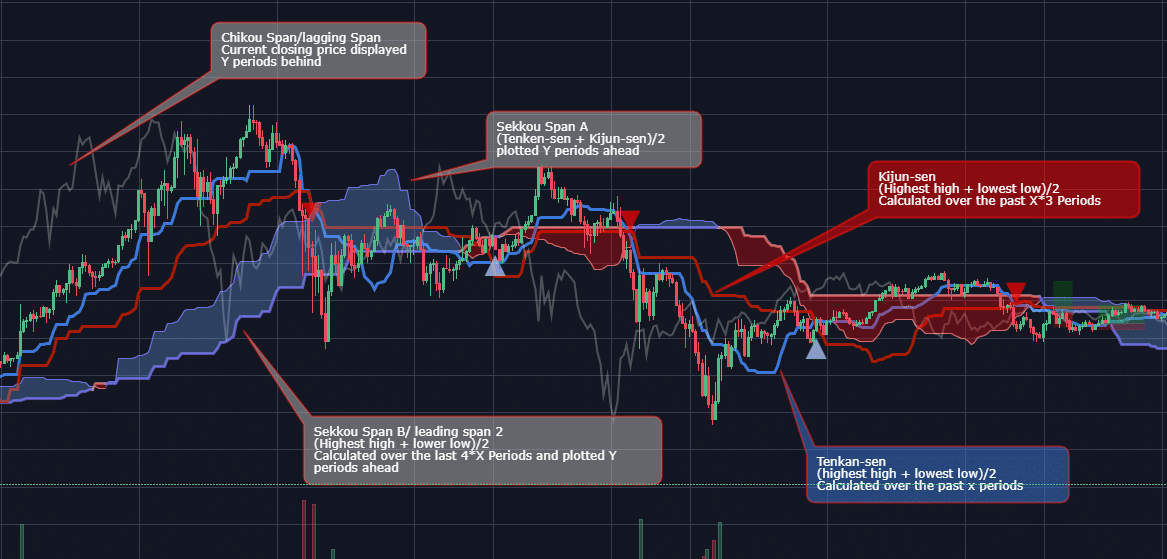
Elements of the Ichimoku Cloud
To make things easier I will abbreviate the terms like so:
- Tenkan-sen = TS
- Kijun-sen = KS
- Sekkou Span A = SA
- Sekkou Span B = SB
- Chikou Span = CS (Current closing price)
The values for each and their respective formula:
(important: since we are trading with crypto, we double all the values since crypto is 24/7. We end up with 20,60,120,120,30)
- TS = (highest high + lowest low)/2 over the last 20 periods
- KS = (highest high + lowest low)/2 over the last 60 periods
- SA = (TS + KS)/2 drawn 120 periods behind
- SB = (TS + KS)/2 drawn 120 periods ahead
- CS = Current closing price displayed Y periods behind
Whatever timeframe you are usingt the TS will calculate( the high + low) of the last 20 candles divided by 2.
Remember. When looking at the ichimoku cloud the higher timeframe wins. Start with Day>4h>2>1h>30min>15min>5min
Overview of the Cloud
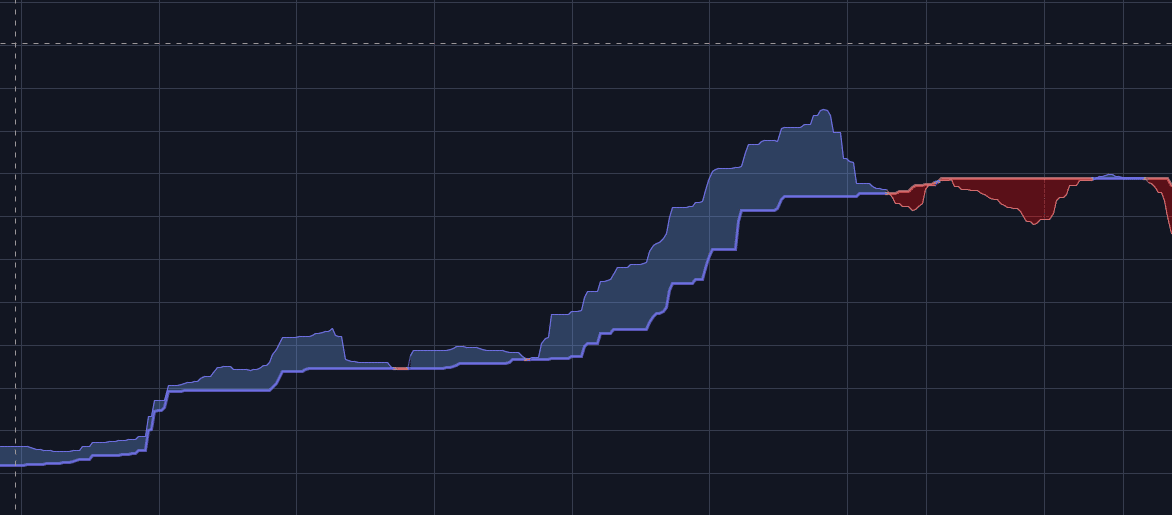
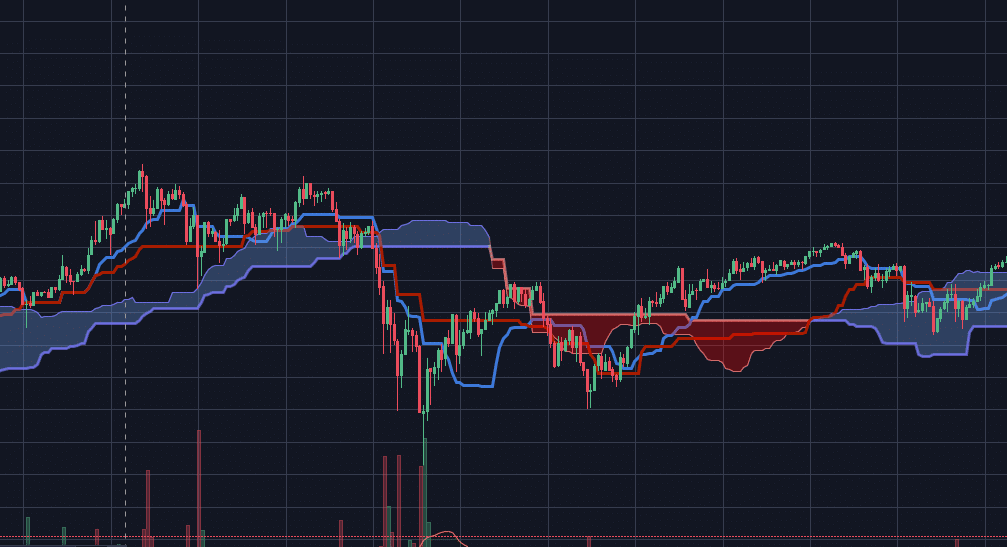
The cloud is calculated with SA and SB.
- When SA is above SB then the cloud is blue and bullish.
- When SB is above SA the the cloud is red and bearish.
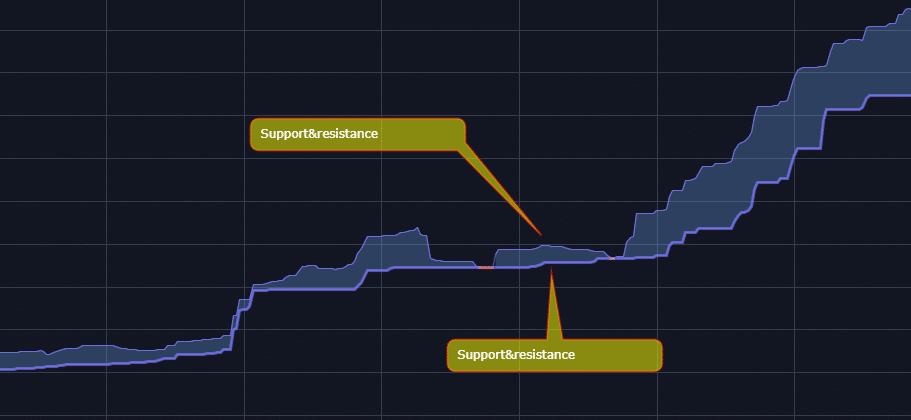
This is nice because you can easily see when there is an uptrend or a down trend. We can also use the cloud to see support and resistance levels
SA being our first support level and SA being our second level when the candles are above the cloud. (When below the cloud SA and SB become resistance levels)
When the price goes down through SA or SB it is known as the cloud break.
Cloud break can be above or below the cloud. Above is bullish under the cloud is bearish
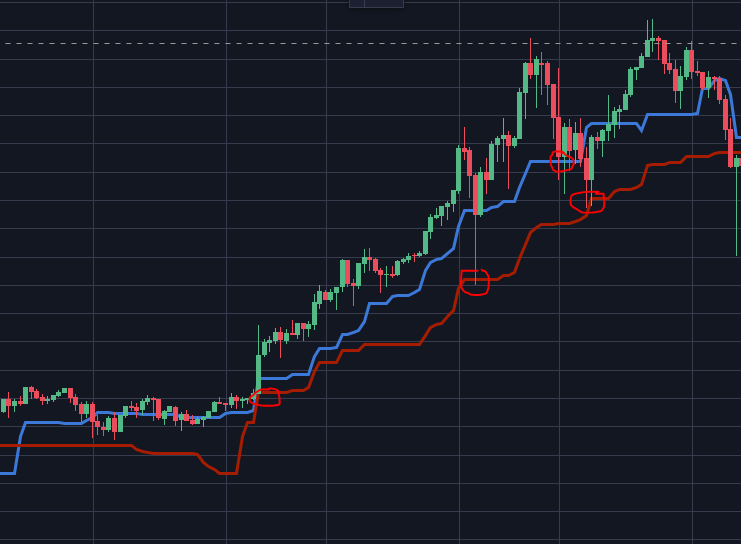
As you can see in the image below, the price comes back to bounce off of the support levels drawn by SA
Investing tip: When you want to add to your position you can stack your buy orders along the SA line if you missed your early entry.
For example daily because this is your overall trend. You might not know where to set your profit area. You might find a good entry on the 1hour timeframe. But you do not know where to sell
so you go back to the 4 hour. Set your line a bit under the sekou span b and you have your exit.
and when you go back to the 1 hour timeframe
you will have your exit or take profit area
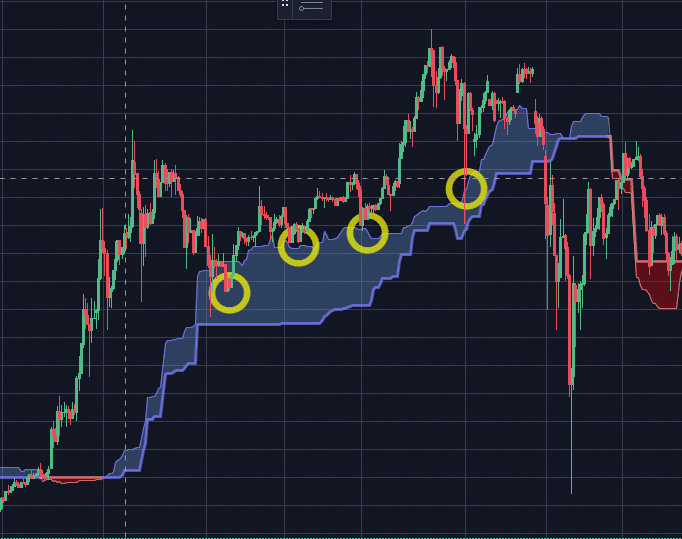
If the price enters the cloud there is a high probability that the price touches the other side of the cloud
Understanding TS
so the ts can tell us the overall trend in the market. Sideway action, you see the uptrends and the downtrends
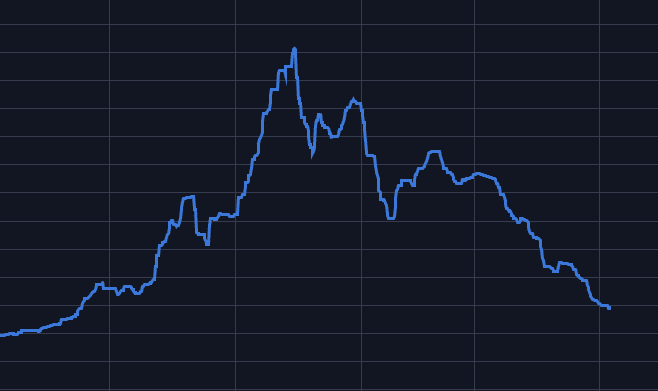
this flatness comes from the way TS is calculated
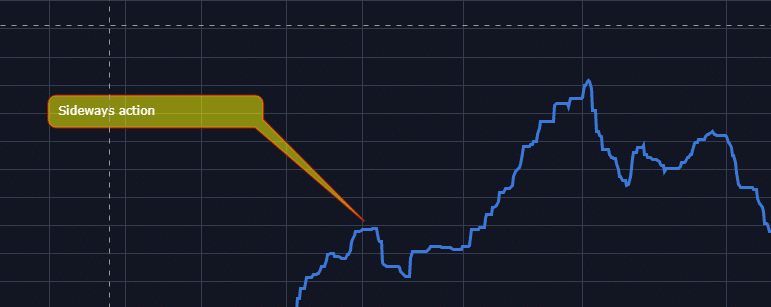
taking the average of the highest high plus the lowest low of the last 20 periods.
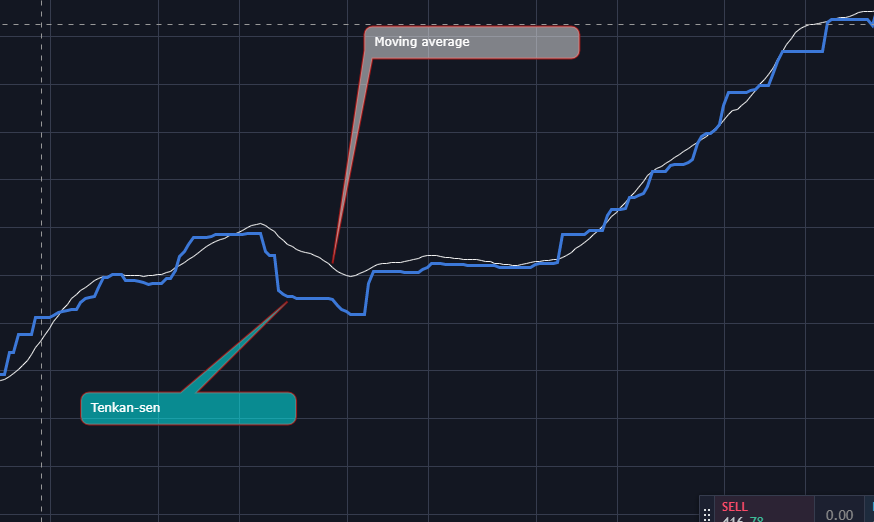
So how is this different from other moving averages?
Example with moving average 20. As you can see with the moving averages there are more rounded dips and not so many flat patterns because the ma is using the closing price of the last 20 periods
Because the TK is calculating the averages of those prices. It makes these flat periods. It means it has been sideways trading for the last 20 periods
The steeper the angle the faster the price moves
Since the TS is the faster moving average we need to be careful in how much weight we put into it. You want to use other indicators to confirm a bull or bear run, trend reversal and so on
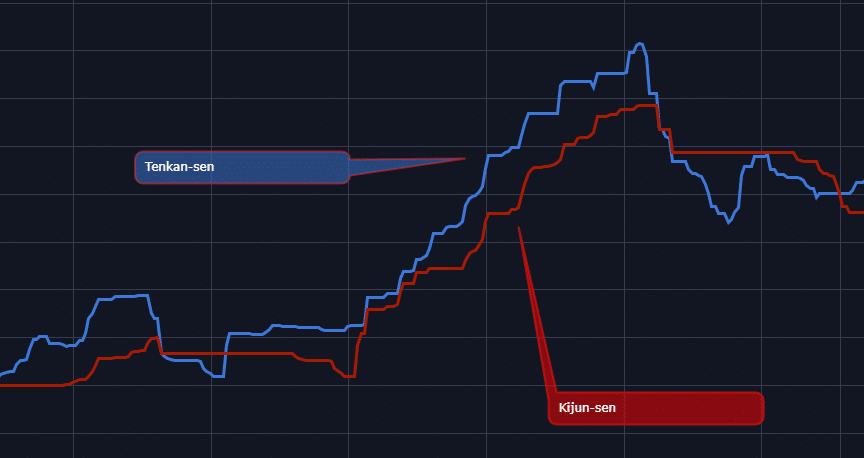
Let’s look at the Kijun-Sen (KS)
Basically it is the same thing as the TS but a longer time period. What it does is it makes it a bit more reliable of an indicator to show if there is a reversal.
It is more reliable because it uses 60 candles instead of just 20. This can be seen as support and resistant levels 1
now as the price moves away from the TKS it comes back and touches the the TKS
The equilibrium is found when TS and KS come together.
This can mean some type of downtrend or retrace
With the cloud back on you can see the price comes into the cloud. This is a big support and resistance area.
Entries and Exits
When we use the KS and TK together you can use it for entries and exits
For example after a big run up. You can exit on the TK or KS flat and look for new entries later on
Magic happens when there is a TK cross
A TK cross happens when TS and KS cross.
- Bullish TK cross is when TS crosses above the KS line
- Bearish TK cross is when TS crosses below the KS line
However, not all crosses are the same. Rule of thumb is to only look for crosses above the cloud for entries and under the cloud for short positions.
Otherwise you might get into trouble with fake breakouts and be stuck in sideways trading.
This is something you want to look for:
- Price closes above the cloud
- Tiki cross (in the cloud)
- TS and KS move together above the cloud
- CS break above the cloud
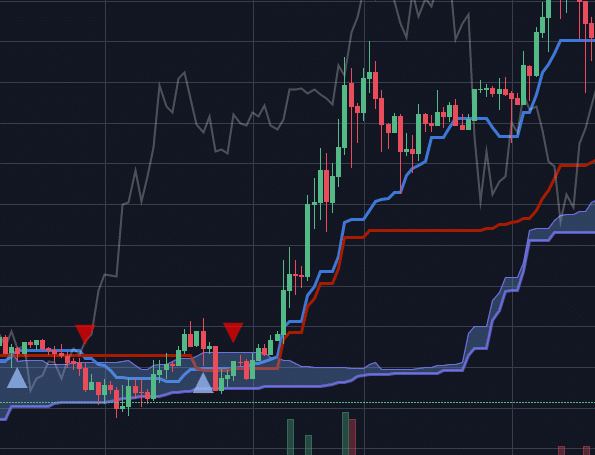
Signals for a very good entry
- Price breaks above the cloud
- TK cross
- CS cloud break
- Cloud twist (we will go over this in another post)
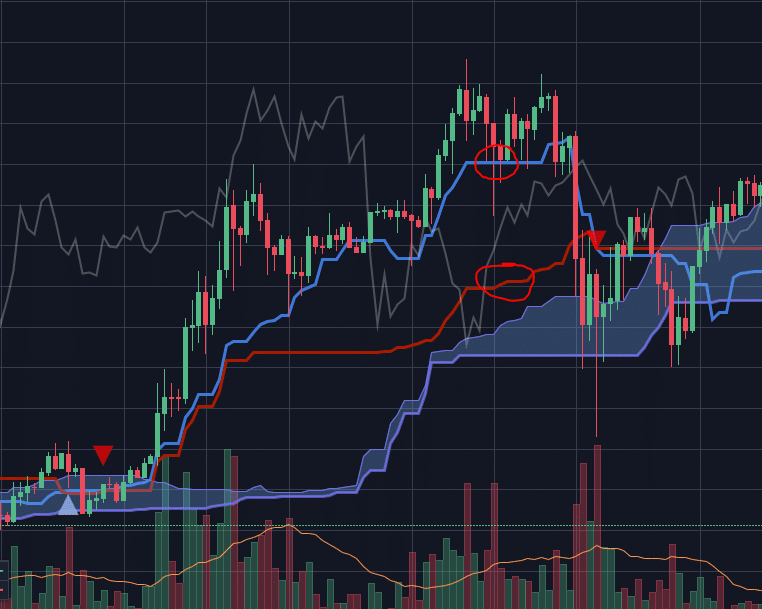
The CS Lagging Span
Often forgotten but very useful.
This is another way of defining support and resistance levels
after plotting lines on every peak
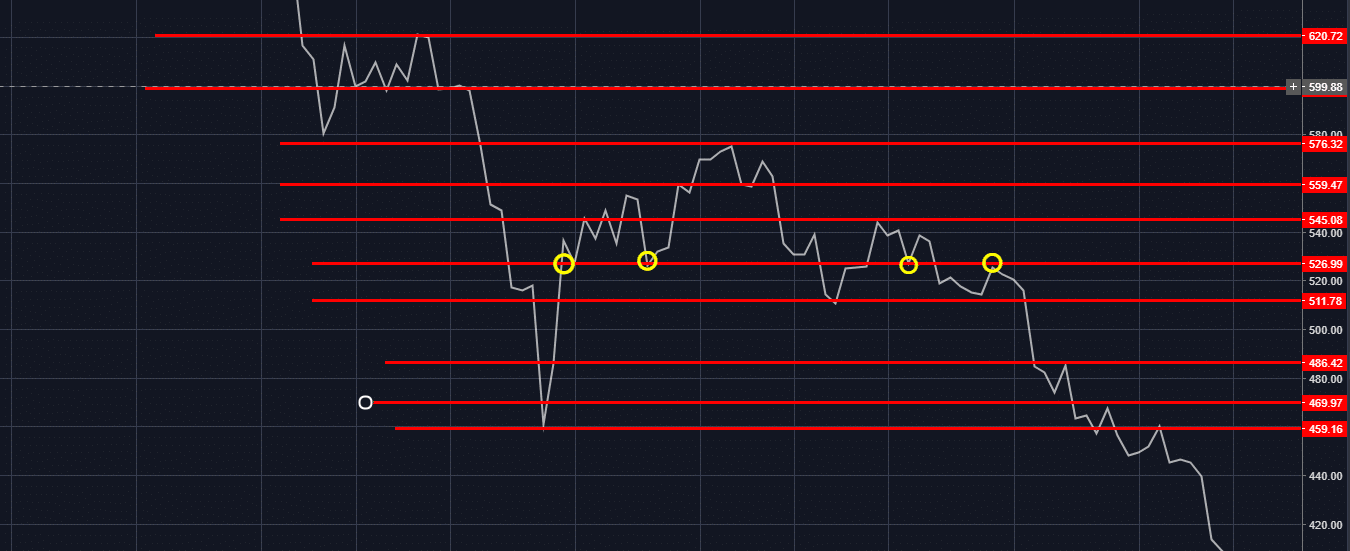
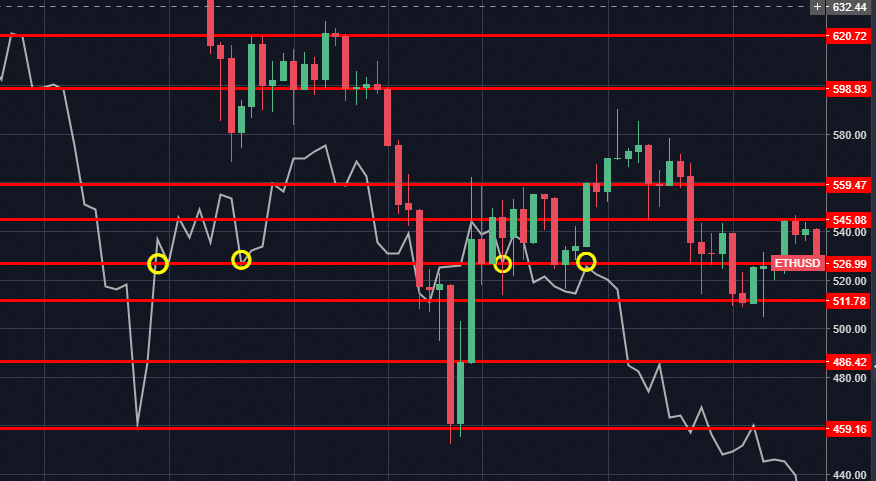
when you have a few lines you can add back the candles
With the candles back on you can see the support and resistance levels clearly
With all the other indicators back on you have a better picture on what is going on
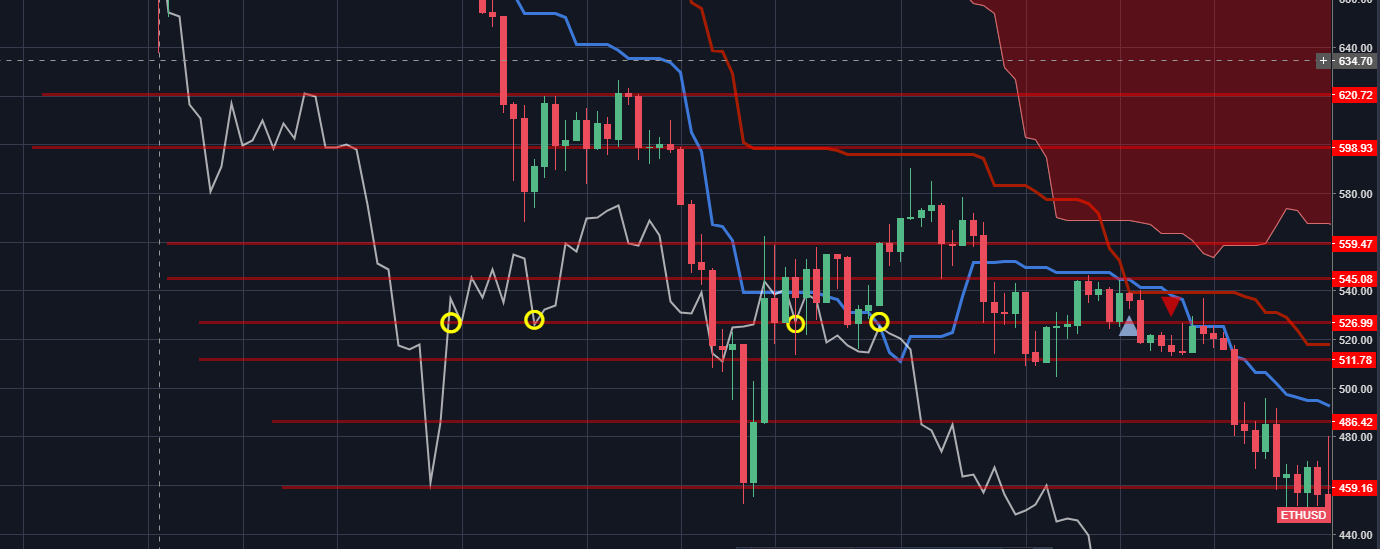
TK cross is under the cloud. We will be not entering a long position.
Looking for an Entry Example ETH/USD
Not a day trade recommendation but still looking for a long term entry position
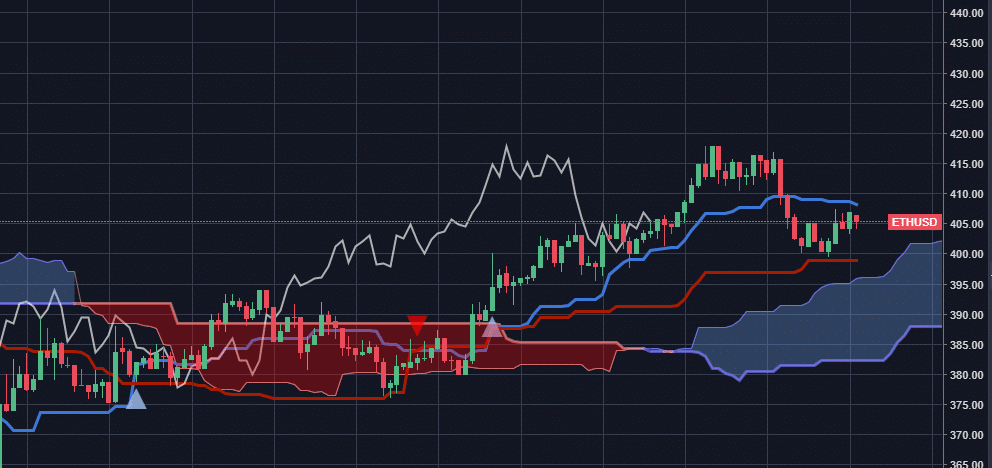
On the 30 minute chart we have the following signals.
- Tiki cross above the cloud
- price close above the cloud
- Chikou span break above the cloud
Before we decide if we want to enter, let’s look at the 1 hour chart
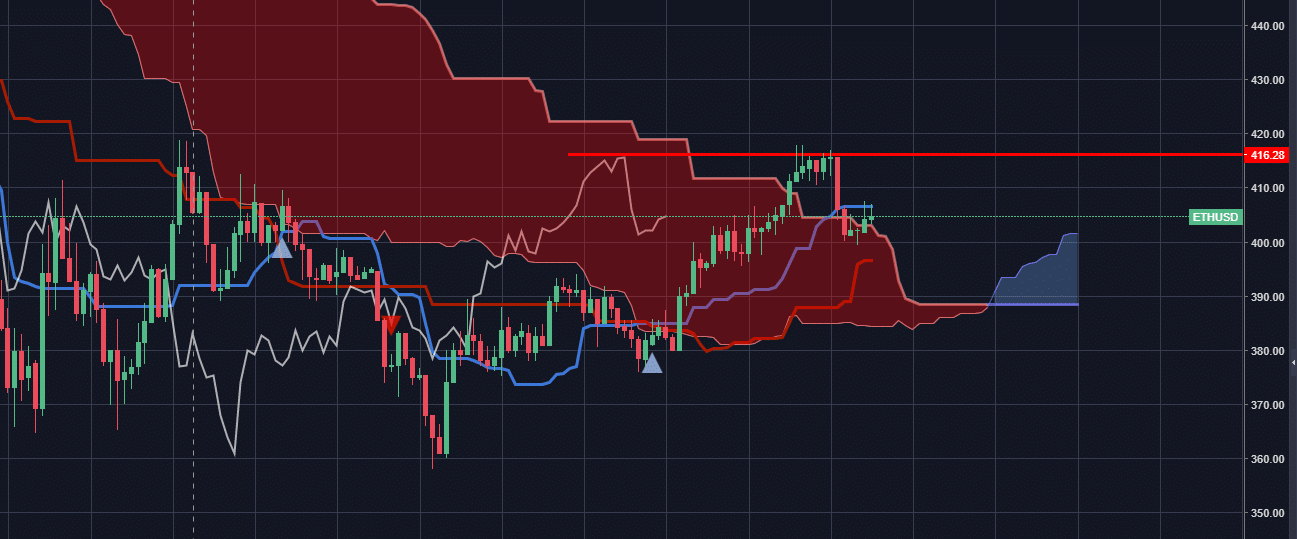
We still do not have all the signals we need if we want to enter into a long term position.
There is a clear resistance at 416$/eth.
- Price break above the cloud is a bullish signal
- Tiki cross under the cloud is alright but not the best signal
- Chikou span bounced off the resistance at 416. I would like to see the Chikou span break through the cloud
- Cloud twist - bullish reversal. This is a very good sign.
The reason we do not want to go in a trade now, is because we could have a lot of sideways action. We do not want to be stuck in a trade.
Let’s look at the 2hour chart. (Higher time frames always wins)
[tv-ideaview idea=”9oa9x03Q” width=”800″ height=”500″ language=”en”]
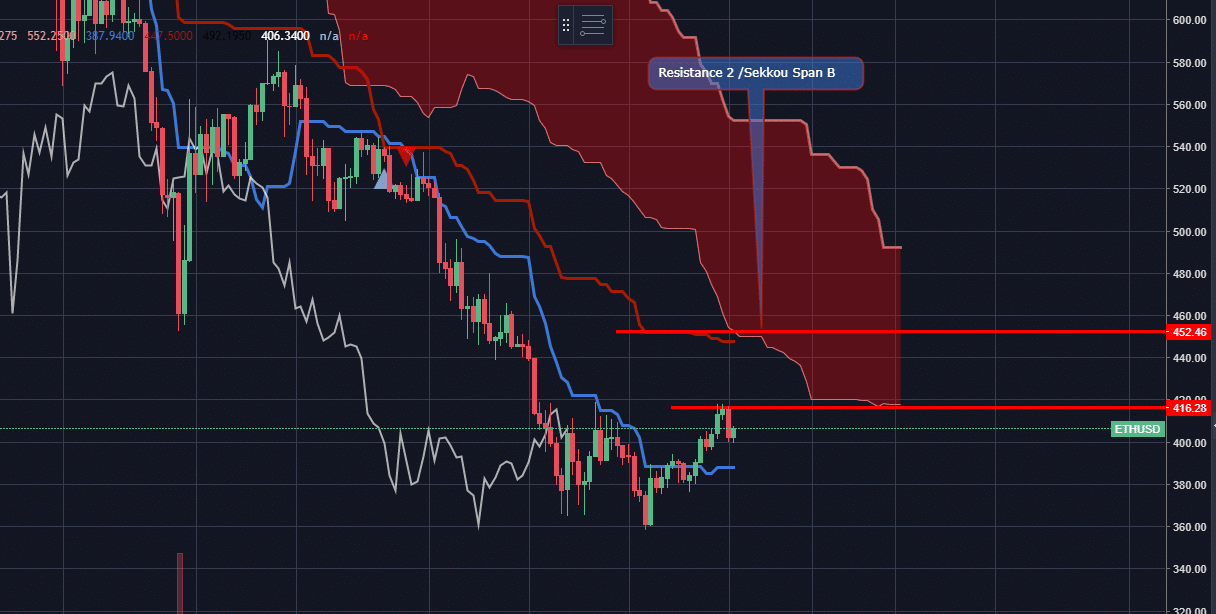
We do not trade in the cloud for a longterm position.
However, you could go in a short term position and trade edge to edge. For example If the candles break through the 416$/eth resistance line. You can go long and scale your sell orders a bit under and above the 452$/eth resistance.
When we look at the 4hour chart we have zero confirmations at the moment. But it is getting exciting.
This is what I suggest if you are thinking about buying long term. Wait for bullish confirmations on the 4hour chart. You can start adding to your position the more bullish confirmations you get.
We need to wait.
So that we are not on the computer the whole day following charts, we can add few alerts in tradingview. If you are not sure how checkout the beginners guide to tradingview
Below I am creating an alert to notify me when there is a bullish TK cross.
Congratulations if you made it all the way down here. Comment, share if you like this introduction to the ichimoku cloud.